Tag: data
Bad Policy, Bad Jobs Data -- So Trump Wants To Erase The Numbers

Bad Policy, Bad Jobs Data -- So Trump Wants To Erase The Numbers

We learned two important, though entirely unsurprising, things last week. One, bad policy matters. It will eventually show up in the data. Two, when it does, the authoritarian responsible for the bad policy won’t like that data, and he will move to block it.

We now have a greater sense that the expected negative impact of Trump’s misguided economic agenda is becoming apparent through the fog.

Prior to last week, I’d often written that while I was seeing cracks in the US economy, they were much more in the soft data—confidence surveys, business plans—than in the hard data. But after last week’s dataflow, there’s more of a hard-data case that if you relentlessly throw terribly misguided policies at the economy, it will eventually cry uncle.

Last year, real GDP grew at 2.5%. So far this year, it’s growing at 1.2 percent. Last year, real consumer spending was up 3%; so far this year, it’s at 0%. This week’s core PCE inflation rate for June came in at 2.8 percemt over the past year, far above the Fed’s 2% target. A few months ago, core (non-energy) goods inflation was around zero; now it’s tracking 3 percent.

The pace of job growth over the past three months was 35,000. That’s far too slow—should it stick—to keep the jobless rate from rising, and in fact unemployment did tick up in July, from 4.1 to 4.2 percent. That’s still a pretty low rate, but we should all be worried about the direction of travel.

On that job-growth deceleration, I know some folks are trying to figure out what to make of the large negative revisions in the payroll data, about which I’ll say more in a soon-to-come future post, but the revisions, while large, made sense to me. I agree with Goldman Sachs researchers on this point:

In our view, the payrolls data had been a bit more puzzling before today’s downward revisions. Payroll growth had sharply outperformed the signal from big data indicators of job growth over the past couple of months, and now has decelerated to a pace that is closer to what other indicators show.

I take zero pleasure from the incoming evidence that President Trump is squandering his inheritance of a strong economy with his trade war, the big, ugly bill, deportations, Fed harassment, and so on. But as the researchers say above, it was more puzzling when these actions weren’t showing up in the data.

Tariff-Induced Inflation is Likely to Worsen

In a piece for msnbc.com, I recently explained why I think we’re seeing the tip-of-the-spear in tariff-induced inflation:

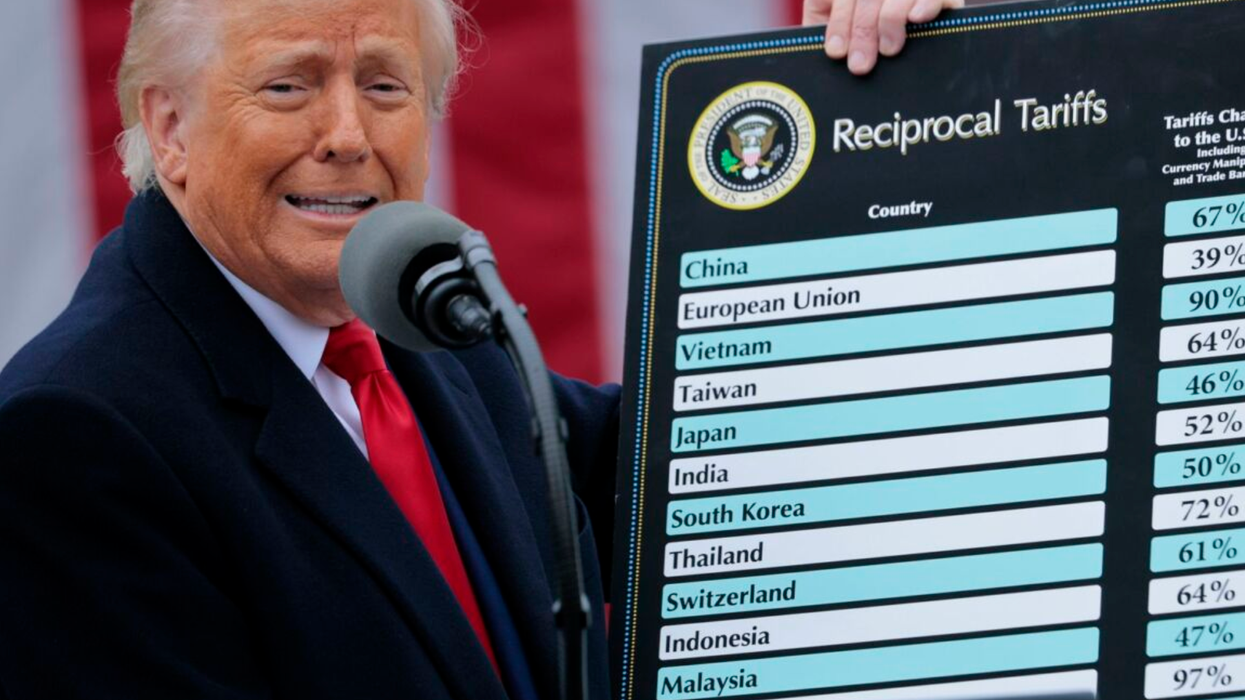
First, Trump is escalating the fight. There was a moment after the first “Liberation Day” on April 2 when tanking markets forced him and his team to temporarily return to reality, pausing the tariffs for 90 days and generally looking for off-ramps. But those days are behind us, in part because markets appear to have, at least for now, adjusted to the trade war, while the hit to consumers is much more of slow burn than a market crash.

Second, this Post article points out that big companies such as Procter & Gamble and Walmart are explicitly raising prices because of tariffs. Other companies, including Ford and GM, and also talking about big, tariff-induced hits to their bottom lines (Ford estimates a $2 billion hit this year). These companies know the Trump administration doesn’t take kindly to such pronouncements. Yet they’re telling it like it is, in part because more consumer pass-through — and thus more price pressures — will be forthcoming.

Third, there were two buffers that heretofore sheltered consumers, both of which are eroding. One was the inventory buildup that started when Trump returned to the Oval Office, as importing firms aggressively stocked up ahead of the tariffs. The other was squeezing profit margins built up during the pandemic to avoid immediately antagonizing inflation-weary consumers. Both buffers worked for a while, but both data and anecdote reveal that they’re winding down.

To be clear, I don’t think inflation is or will be spiraling up. This trade war will continue to cause a lot of pain both here and abroad, but we shouldn’t forget that goods imports, which were under three percent of GDP in the 1950s, are still only around 11 percent But neither would I count on trade-war inflation being any sort of one-and-done phenomenon.

The problem is the August 1, or August 7, or whatever-it-is deadline is no deadline at all. Trump will continue to war with other countries around trade issues, especially when his minions have to confess that the side deals—all those billions other countries said they’d buy from and invest in the U.S.—are all flimsy, unenforceable nonsense. My strong prior is that Trump doesn’t stop negotiating trade “deals” until he leaves the building.

Authoritarian Statistics Are Different from Real Statistics

Along with 221,000 unemployed in July, there was another consequential job loss this week: that of Erika McEntarfer, the former Commissioner of the Bureau of Labor Statistics. Ms. McEntarfer worked for me at the CEA, so I have up-close experience with her work, which is top-notch. She’s extremely knowledgeable, especially about labor-market data, and, like most people who really understand their work, can plainly explain it. And she’s all about the integrity of the numbers. Her thumbs will never be seen anywhere near the scales.

But when someone who resides in an alternative reality is hit with evidence that contradicts that reality, he can reject either his false edifice or the evidence of its falsehood. Trump, predictably, chose the latter.

Does this mean we can we now no longer trust the numbers from BLS or the other government agencies? I’ve long been asked this question a lot by people worrying that the Trump administration would have no compunction against cooking the books. I’ve always shared that worry but I know these agencies, all of which are staffed by public servants with high integrity and a strong culture of delivering the most accurate data possible. They would not play along with book-cooking.

But I’m now more worried about this than I’ve ever been. I still believe that, for now, we can trust the numbers. The staffs are still in place. If—I’d say “when”—Trump puts in a lackey as BLS commissioner with orders to serve up better jobs numbers, regardless of what the actual data say, the staff would resist and we’d likely hear about the pressure on them to lie.

But there are other ways he can go, including cutting budgets (thereby lowering survey sizes and response rates, leading to less accurate statistics), firing other key personnel, delaying publications, or whatever such chicanery they’re cooking up in their cabal of a White House.

What he showed by firing McEntarfer is that he wants to control and manipulate the facts. That’s neither new nor surprising but it is a step further than he’s gone heretofore. Before this, Trump could say the unemployment rate “is 28, 29, as high as 35. In fact, I even heard recently 42 percent,” as he did when he was running for office and lying to make things look worse, but we could pull up the data and show that he’s wrong.

We are now a firm step closer to not having, at least from an official source, that actual data. And that same firm step takes us down the path to a failed state, a banana republic, an Orwellian, authoritarian regime where the facts are what the leaders say they are.

What a Week

All that in one week.

To which I say, stay strong, my readers. This is far, far from over. The data are still intact and they’re showing with increasing clarity that Trump’s awful economic policy is hurting people. And with the tariffs, they’re hurting people in an especially economically sensitive place: by making life less affordable, which in poll-after-poll is the number one problem with which people say they’re struggling.

Trump can fire all the messengers he wants, but that’s not going to repair the damage he’s causing. It is thus up to the rest of us, with an even greater urgency than existed before, to relentlessly make sure everyone knows, in whatever outlets we can access, with whatever accurate data and anecdotes we can muster, what he’s doing and what impact it is having.

Jared Bernstein is a former chair of the White House Council of Economic Advisers under President Joe Biden. He is a senior fellow at the Council on Budget and Policy Priorities. Please consider subscribing to his column for free at Jared's Substack.

Reprinted with permission from Substack.

Analysis: Why It’s So Hard To Understand 2016 With Numbers Alone

Analysis: Why It’s So Hard To Understand 2016 With Numbers Alone

By Ken Goldstein, Bloomberg News (TNS)

WASHINGTON — The new breed of cool analytical election observers — from Nate Silver to the folks at the Upshot or Monkey Cage — roll their eyes and sigh deeply at the frenzy of coverage about Donald Trump, the media scrum about Hillary Clinton’s emails, and the speculation about whether Joe Biden will enter the presidential race. Instead, they argue, one should simply pay attention to the fundamentals and not worry about campaigns, debates, events, or even, seemingly, the identities of the candidates.

I’m all for models based on objective and quantifiable data like the state of the economy or the likely demographics of the electorate. They force analysts and observers to be precise and transparent about their assumptions. One can disagree with those assumptions, but at least one knows exactly what those assumptions are.

The problem with that approach is, when it comes to primaries, the fundamentals are not nearly as well understood or as predictive as they are in general elections. In other words, predicting the arc and ultimate outcome of the presidential nomination process is much more difficult than analyzing general elections. Partisanship and assessments of how the incumbent party is doing are absent when one is looking at primaries.

Presidential nominations are not single-day contests with two candidates from clearly defined parties competing to get the plurality of the vote in enough states to garner 270 Electoral College votes. They are dynamic multi-month, multi-candidate contests between rivals who often differ little on the issues and compete to win delegates in states, which often have different sets of rules. They are a process in which, as scholars like Vanderbilt University’s Larry Bartels have shown, previous primary performances and expectations can influence subsequent contests. In short, while it may prove to be short-lived, momentum matters.

Furthermore, even in general elections when we can model with fairly tight precision likely outcomes, much of the analysis and most of the “modeling” tend to rely on the very same polls that more traditional observers of politics utilize. They may, like many of the more traditional observers, augment those polls with their assessments of the national environment or the quality of the candidates and their campaigns, but many of the predictions are basically based on polls.

So, what would a passion-free focus on the most recent poll numbers tell us?

Well, in one contest, according to the Pollster.com averages, there is a candidate comfortably at the top of the national polls of what is universally considered to be a strong field of 16 candidates that includes four sitting U.S. senators and four sitting governors, as well as former governors from two of out of the three largest states in the country.

This candidate enjoys a 15 percentage-point lead over the second place contestant in national polls (and together they are the only candidates with double-digit support). This candidate is leading the pre-race favorite by a margin of nearly four to one and has almost three times as much support as the four sitting senators combined. That same candidate is also leading beyond the margin of error in the crucial early nominating contests of Iowa and New Hampshire. In both national and state specific polls, the lead has grown since the start of the summer as has this candidate’s favorability ratings among potential primary voters. This candidate is well-funded and, to date, has spent no money on television advertising.

In the other contest, according to Pollster.com, the leading candidate has a similarly sized lead, 18 percentage point lead — but in a field that is considerably smaller and that includes one sitting U.S. senator (who is actually not a member of the party whose nomination he is running for) as well as three former office holders (two of whom used to be members of the other party).

Looking at Pollster.com’s aggregation, the national lead is about half of what it was at the start of the summer with a new ABC News/Washington Post poll showing a drop of 20 percentage points in support. According to the Pollster.com average, this candidate is trailing in New Hampshire and leading in Iowa (with both races within the margin of error). But a CBS News/YouGov poll this week also showed this candidate trailing in Iowa. This candidate has spent heavily on advertising in the early states with no opposition on the air.

So, what is the conventional wisdom from the cool analytical kids and the old guard of political pundits? It turns out that it is exactly the same. They both say that the first candidate has virtually no chance at the nomination and the second remains the presumptive nominee.

The first candidate is obviously Donald Trump and the second Hillary Clinton. Why does Clinton’s shrinking lead in national polls and weakness in early states make her likely to win, while Trump’s expanding lead in national polls and strength in early states give him almost no chance of being the Republican nominee? How can it be too much too early to take Trump seriously and dangerously late for Vice President Joe Biden to mount a challenge?

One thing is clear: The answers to those questions do not flow from just looking at polling numbers. Ultimately, the work of the data journalists and more traditional observers of politics include a good dose of instinct.

Endorsements have become the favorite fundamental or favorite tell for modelers. While the causality is not clear, endorsements certainly correlate with outcomes. Front-runners with large numbers of early endorsements like Walter Mondale in 1984, Bob Dole in 1996 and George W. Bush in 2000 tended to fare well.

It is certainly the case that Clinton has an overwhelming lead in the endorsements race. But something is making Joe Biden take another look. While it is clearly a deeply personal decision, some part of that decision is based on his calculation on whether or not he could win the Democratic nomination. Clearly, while estimating that precise number is difficult, it is clearly higher than it was at the beginning of the summer.

So, yes, it’s early. Clinton remains the favorite to be the Democratic nominee and has a solid chance of becoming the 45th president. But Clinton had a terrible, horrible, no good, very bad summer that has shrunk her lead in the Democratic primary and wounded her reputation with general election swing voters to the point that she is running neck and neck with Donald Trump in general election match-ups. Of course, polls today are not predictive of November 2016 results, but they may end up getting her a challenge from a sitting vice president. And, if you want to look at correlations from previous nomination fights as a guide or “model,” the last four sitting vice presidents who sought their party’s presidential nomination succeeded — Al Gore in 2000, George H.W. Bush in 1988, Hubert Humphrey in 1968 and Richard Nixon in 1960.

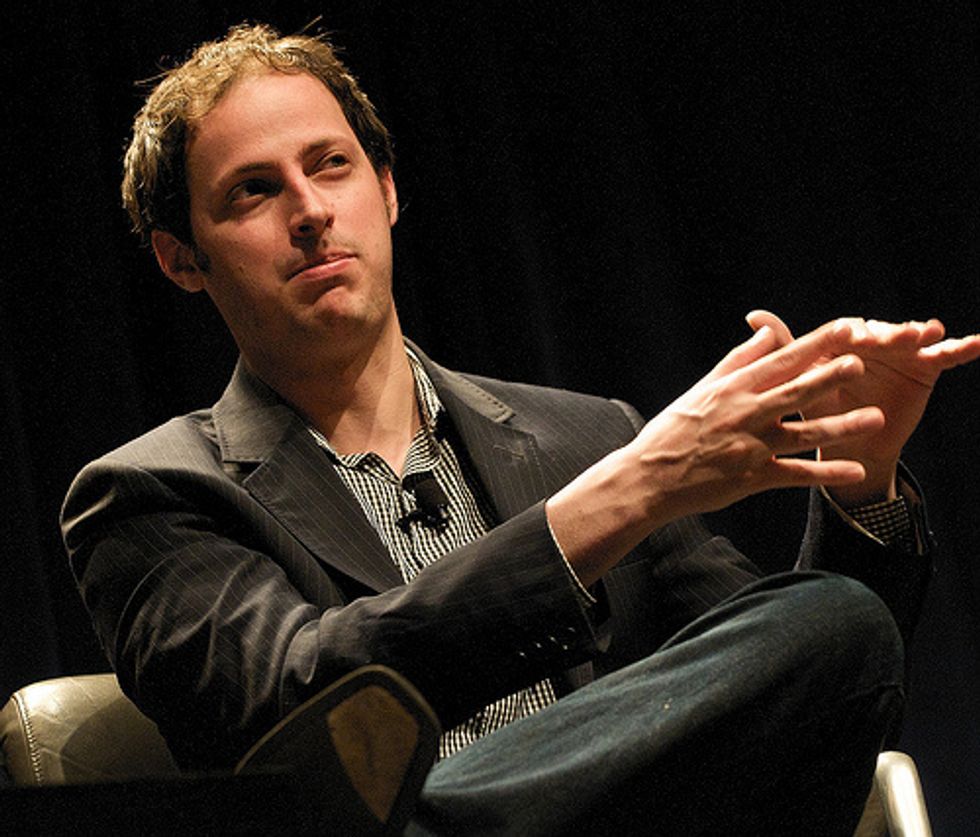
Photo: This man — Nate Silver — is not the be-all and end-all of presidential futurism. (CC) JD Lasica, Socialmedia.biz

A Cybersecurity Turf War At Home And Abroad

A Cybersecurity Turf War At Home And Abroad

By Shawn Zeller, CQ-Roll Call (TNS)

WASHINGTON — The House passed not one, but two, bills last week to provide immunity from consumer lawsuits to companies that share with each other, and with the government, information about cyberthreats and attacks on their networks.

It’s clear that majorities of both parties believe greater cooperation between business and government is needed to fight the hackers who have stolen data from some of America’s biggest companies.

What’s less clear is how the process is going to work. In passing two bills, instead of one, House leaders gave an ambiguous answer.

The differences between the bills are significant. The first bill, a product of the Intelligence Committee, would allow companies to share data with any federal agency, except the Defense Department, and receive liability protection.

The second bill, drafted by Homeland Security Committee Chairman Michael McCaul of Texas, would require that companies go to the National Cybersecurity and Communications Integration Center, a new division within the Homeland Security Department, if they want immunity.

Both McCaul and Intelligence Committee Chairman Devin Nunes of California, who sponsored his committee’s bill, had only praise for each other last week. But normally committee chairmen who both have a stake in an issue and want to produce the best possible bill work together to reconcile differences in advance of a vote. In this case, they didn’t.

It’s no surprise that McCaul wants the new Homeland Security Department cybersecurity center to play a critical role. He sponsored the bill that created it last year and he was annoyed earlier this year when President Barack Obama announced the creation of a new agency, under the Director of National Intelligence, to coordinate the government’s cybersecurity response. McCaul wrote to Obama in protest. He said the two centers appeared to be duplicative.

But the Intelligence Committee bill passed last week would give the new White House cybersecurity center, known as the Cyber Threat Intelligence Integration Center, Congress’ blessing by authorizing it.

“Because there seems to be some kind of turf war between the Intelligence Committee and the Homeland Security Committee, we’re actually voting on two overlapping bills that in several respects contradict one another,” Democratic Representative Jared Polis of Colorado said during the floor debate last week.

The measures differ in another significant way. McCaul’s bill would allow the Homeland Security Department to share cyberthreat information it receives from companies with other government agencies, but they’d be barred from doing anything with it except fight hackers.

The Intelligence Committee bill would allow the government to use the data to respond to, prosecute, or prevent “threats of death or serious bodily harm,” as well as “serious threats to minors, including sexual exploitation and threats to physical safety.”

Polis, whose view was clearly in the minority, argued that might allow the feds to go after him for failing to babyproof his house.

The bills have other differences. Their definitions of what qualifies as cyberthreat information varies, as do their definitions of the “defensive measures” the bill authorizes companies to take to combat hackers.

Both bills aim to ensure that personal information about consumers that’s irrelevant to a cybersecurity threat isn’t distributed. They do that by requiring both the companies sharing data and the government agencies receiving it to erase it.

But McCaul’s bill would task the Homeland Security Department’s chief privacy officer and its officer for civil rights and civil liberties, in consultation with an independent federal agency known as the Privacy and Civil Liberties Oversight Board, with ensuring that happens. The Nunes bill, by contrast, would place responsibility for writing privacy guidelines in the hands of the attorney general.

House leaders will get to decide what happens next. A House leadership aide said Nunes will get his way on at least one of the big issues: Companies will be able to provide cyberthreat information to any non-Defense Department agency and receive liability protection. It’s not yet clear how the leaders will come down on the other differences.

It is clear that privacy advocates, as well as House members, prefer McCaul’s bill. It passed with 355 yeas compared to 307 for Nunes’ bill. But if only one of them is to become law, it’s more likely to be the Nunes bill.

The Senate’s companion measure is an Intelligence Committee bill sponsored by Republican Richard M. Burr of North Carolina, who’s well-known for stressing security over privacy. Burr last week introduced a bill to extend the authorization for the National Security Agency’s controversial phone record collection program to 2020. His cybersecurity bill hews more closely to the Nunes version than McCaul’s.

Senate Majority Leader Mitch McConnell of Kentucky hasn’t set a date for considering Burr’s bill, but it is expected to pass easily. The Intelligence Committee approved it in March on a fourteen-one vote. Only civil liberties advocate Ron Wyden, an Oregon Democrat, objected.

Photo: Michael McCaul via Facebook

Cities Turn To Social Media To Police Restaurants

Cities Turn To Social Media To Police Restaurants

By Jenni Bergal, Stateline.org (TNS)

WASHINGTON — Many diners regularly click onto the Yelp website to read reviews posted by other patrons before visiting a restaurant. Now prospective customers also can use Yelp to check health inspection scores for eateries in San Francisco, Louisville, and several other communities.

Local governments increasingly are turning to social media to alert the public to health violations and to nudge establishments into cleaning up their acts. A few cities are even mining users’ comments to track foodborne illnesses or predict which establishments are likely to have sanitation problems.

“For consumers, posting inspection information on Yelp is a good thing because they’re able to make better, informed decisions about where to eat,” said Michael Luca, an assistant professor at Harvard Business School who specializes in the economics of online businesses. “It also holds restaurants more accountable about cleanliness.”

The Centers for Disease Control and Prevention estimates that more than 48 million people a year get sick from foodborne illnesses, 128,000 are hospitalized and 3,000 die. About 60 percent of outbreaks come from restaurants, according to the CDC.

Restaurant inspections, which are usually conducted by city or county health departments, vary across the country in frequency and in how scores are computed and citations are handled. Most, however, include surprise inspections and cite restaurants for high-risk violations, such as a refrigerator’s temperature not being set at the proper level or staffers using the same cutting board to make salad and handle raw chicken.

In recent years, dozens of city and county health departments have been posting restaurant inspection results on government websites to share with the public. Turning to Yelp or other social media, or using crowd-sourced information to increase public awareness, is the next logical step, some officials say.

“Yelp is a window into the restaurant. The restaurateurs don’t want a bad (health) score on Yelp. They’ll be more attentive about getting the restaurants cleaned up and safer,” said Rajiv Bhatia, former environmental health director for the San Francisco Department of Public Health.

“It’s also valuable because it allows the public to see the workings of a government agency and puts some pressure on the agency to do its job,” said Bhatia, a physician who is now a public health consultant.

In 2005, San Francisco was one of the first cities to put its restaurant inspection information online. Eight years later, it was in the forefront once again, becoming the first city to sign onto the Yelp initiative to list health scores alongside diner reviews.

The city’s health department, which is responsible for inspecting 3,300 restaurants and another 2,200 establishments that prepare food, says the program is working well.

“It gives more information to the public about making decisions as far as where to go to eat,” said Richard Lee, the department’s acting director of environmental health. “Someone might not go to a restaurant based on the score they see on Yelp.”

Lee said that initially, only inspection scores and violations were posted on Yelp. But after getting complaints from local restaurants, he said the site also added the date the violation was corrected.

The National Restaurant Association, the industry’s trade group, said that while it supports transparency and consumers’ access to information, it worries that because inspection standards differ from city to city, Yelp users may not be familiar with rating terminology and therefore, could draw incorrect conclusions.

David Matthews, the association’s general counsel, also said the timing of postings is critical because restaurants often correct findings and generate different ratings after a re-inspection.

“I could be inspected today and fail, and fix the problem tonight and have an inspector back out. But if Yelp only receives a weekly or monthly update, then I’ll be on the Yelp system for up to a month with a violation or a failure. That’s not an accurate reflection of the status of my restaurant,” Matthews said. “A fair system is crucial to restaurants, the majority of which are small businesses.”

Yelp collaborated with officials in San Francisco and New York to develop the open data tools that allow health departments to publish inspection information on the site or any other one that offers restaurant listings. They decided on a common format to report the data. Each city or county is responsible for making electronic information available in that format. Yelp’s software collects the data from health departments and puts it on its website.

So far, seven city or county health departments have joined the program, among them Los Angeles County, which includes the city of Los Angeles, and Wake County, N.C., which includes Raleigh. More are coming on board this year, according to Luther Lowe, Yelp’s director of public policy.

“The idea is to create a public-private partnership that’s a win-win-win,” Lowe said. “It empowers consumers with helpful information that’s germane to their dining decisions. It helps the cities by making their data more useful to their citizens. And it’s great for Yelp, because it makes the site even more useful.”

Lowe said Yelp has more than 135 million unique monthly visitors, and restaurant reviews are among the most common destinations.

Putting health scores and inspection results in an accessible place where consumers already are searching for restaurant information, he added, makes a lot more sense than “relying on those clunky (health department) dot.gov websites.”

New York City has used Yelp reviews in a different way. Its Department of Health and Mental Hygiene launched a nine-month pilot study in July 2012 that used data-mining software to screen and analyze about 294,000 Yelp reviews. It searched for keywords such as “sick” or “food poisoning,” to find cases of foodborne illness that may not have been officially reported. The findings, which were published in a 2014 CDC report, uncovered three unreported outbreaks linked to 16 illnesses and identified multiple food-handling violations at the restaurants.

The authors cautioned that while it may be beneficial to incorporate review information into the surveillance process to find foodborne illnesses, the process also requires “substantial resources,” including programming expertise and staffers available to read reviews, send emails, and conduct interviews.

In a prepared statement to Stateline, the health department said that through the partnership with Yelp, it had identified four additional outbreaks since the study ended. “We are currently working to expand the project to add additional sources of social media data,” the department said.

Chicago has taken a different route. There, the Department of Public Health and a group of civic organizations launched a project in 2013 that identified and responded to restaurant complaints on Twitter. Over ten months, staffers used an algorithm to track Twitter messages about foodborne illness. They identified people whose tweets mentioned words such as “food poisoning” or “stomach cramps.” They contacted them and sent them links to an online complaint form. A total of 133 restaurants were inspected, according to a health department report published by the CDC. Of those, nearly 16 percent failed inspection, and about 25 percent passed but had conditions that indicated critical or serious violations.

Chicago health officials also recently completed a “predictive analytics” pilot project that used software to aggregate real-time data such as previous citations, social media comments, building code violations and nearby construction. The goal was to try and predict which restaurants would be most likely to fail an inspection or draw violations and which should be targeted for visits.

The health department would not make anyone available to Stateline to discuss the pilot program.

Bhatia, the former San Francisco environmental health official, said putting inspection data on Yelp or similar sites would result in safer conditions for diners because it would force restaurants to pay more attention to workplace practices that result in hazards. It also would alert inspectors to problems they may not know about, he said.

Bhatia said that predictive analytics also can be valuable, if it includes not only a history of inspections and social media comments, but environmental conditions, such as the building’s quality and occupational hazards for workers. Cities could use that data to move from routine inspections to targeted ones, he said.

For Luca, the Harvard Business School economist, using algorithms is the way to transform restaurant inspections.

He points to a 2013 study he co-authored that mined seven years of Yelp reviews in Seattle. It concluded that online postings can be used to predict the likely outcome of a restaurant’s health inspection.

Luca said that given the results of his study and others, restaurant inspectors need to change the way they do business. Instead of conducting random inspections two or three times a year, he said health departments should search online reviews using an algorithm that would tell them which places to inspect on which days. That information would come from Twitter, Yelp and other social media over time.

Luca said he envisions health departments performing random annual inspections and doing additional ones only when the algorithms signal something bad is going on. “There would be a large-scale reallocation of inspectors targeted at the places most likely to have violations,” he said.

The major challenge, Luca said, is for officials to come up with the details of how such a new inspection process would work.

“The science is there; the data is there; the human capital is there,” Luca said. “The process itself would be no more complicated than the current one. The biggest barrier is logistical.”

Luca and three of his collaborators at Harvard are so big on the idea they’re running a competition in Boston this month funded by Yelp. They’re asking people to devise their own algorithm to pinpoint violators. The winner will receive $3,000 and the two runners-up each will get $1,000.

“Cities haven’t acted because of inertia. They’re used to doing it the old way,” Luca said. “This is a great opportunity for local governments that are looking to innovate and cut through bureaucracy.”

Photo: Michael Dorausch via Flickr

Shop our Store

Headlines

Editor's Blog

Corona Virus

Trending

World